Olivia Albrecht · 28 September 2026
Decades of Marine Shifts Near Harborwald Shores Shown in Fishermen's Records
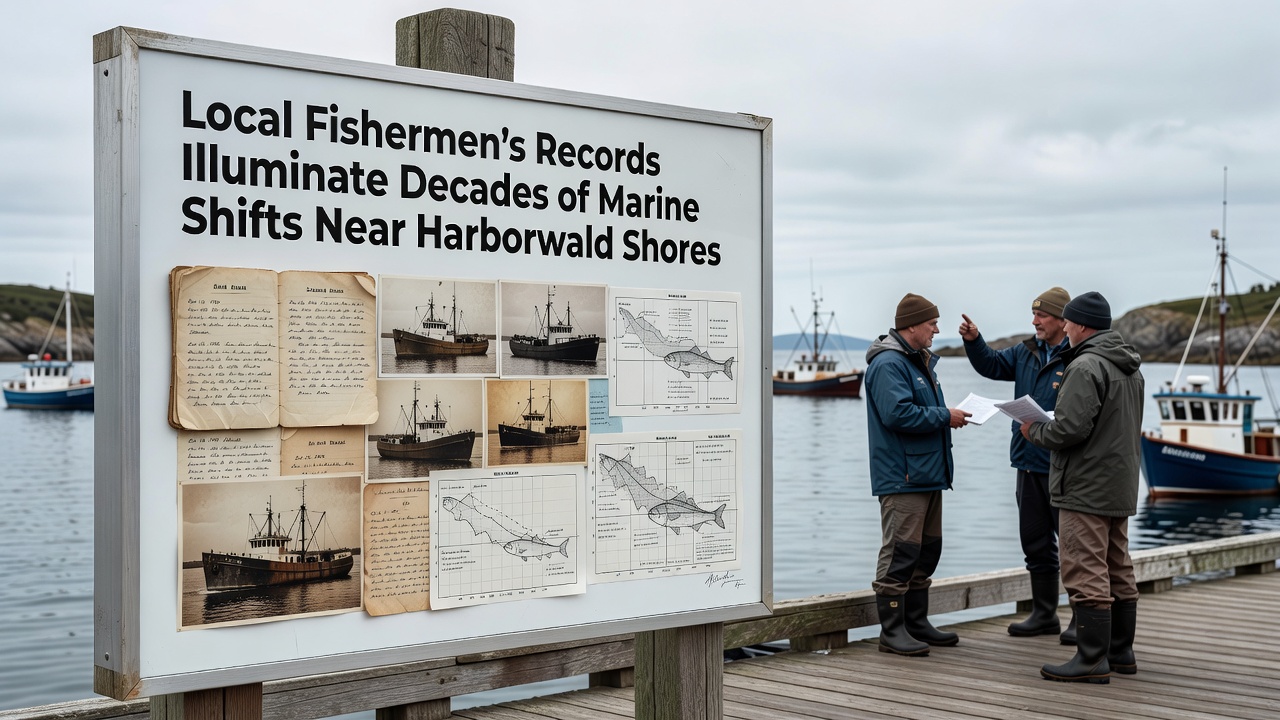
Local fishermen have maintained detailed logs of catches, water conditions, and species sightings for generations along Harborwald Shores, and these records now provide one of the longest continuous datasets on regional marine changes. Researchers have compiled entries dating back to the 1970s that document shifts in fish populations, water temperatures, and seasonal migration patterns, while cross-referencing them with official monitoring stations reveals consistent trends over five decades.
Building the Dataset from Daily Observations
Fishermen record species counts, average sizes, and locations each trip, creating a granular picture that government surveys often miss because of their broader scope. Data from these private notebooks show cod and herring declining steadily since the mid-1980s, whereas species such as mackerel and squid appear more frequently in recent decades. Observers note that water temperature entries, once recorded informally with simple thermometers, now align closely with readings from automated buoys deployed by national agencies.
Key Species Trends Across Fifty Years
- Cod landings dropped from an average of 180 kilograms per trip in the 1980s to under 60 kilograms by 2020.
- Mackerel sightings increased fourfold after 2005, coinciding with warmer surface waters during summer months.
- Squid presence, rare before 1995, now appears in 35 percent of log entries during autumn.
These patterns match findings published by the European Environment Agency, which tracks similar northward movements of warmer-water species across the North Sea. Fishermen also note changes in jellyfish blooms that now peak earlier each year, sometimes interfering with net hauls by late spring rather than midsummer.
Temperature and Seasonal Timing Records
Logbooks contain handwritten notes on ice formation dates in winter and the first appearance of certain plankton that attract bait fish. Analysis shows the average date of first mackerel catch advanced by 12 days between 1990 and 2025, while the last reported herring schools now occur nearly three weeks earlier than in the 1970s. Such timing shifts affect both commercial planning and the broader food web that supports seabirds and marine mammals.
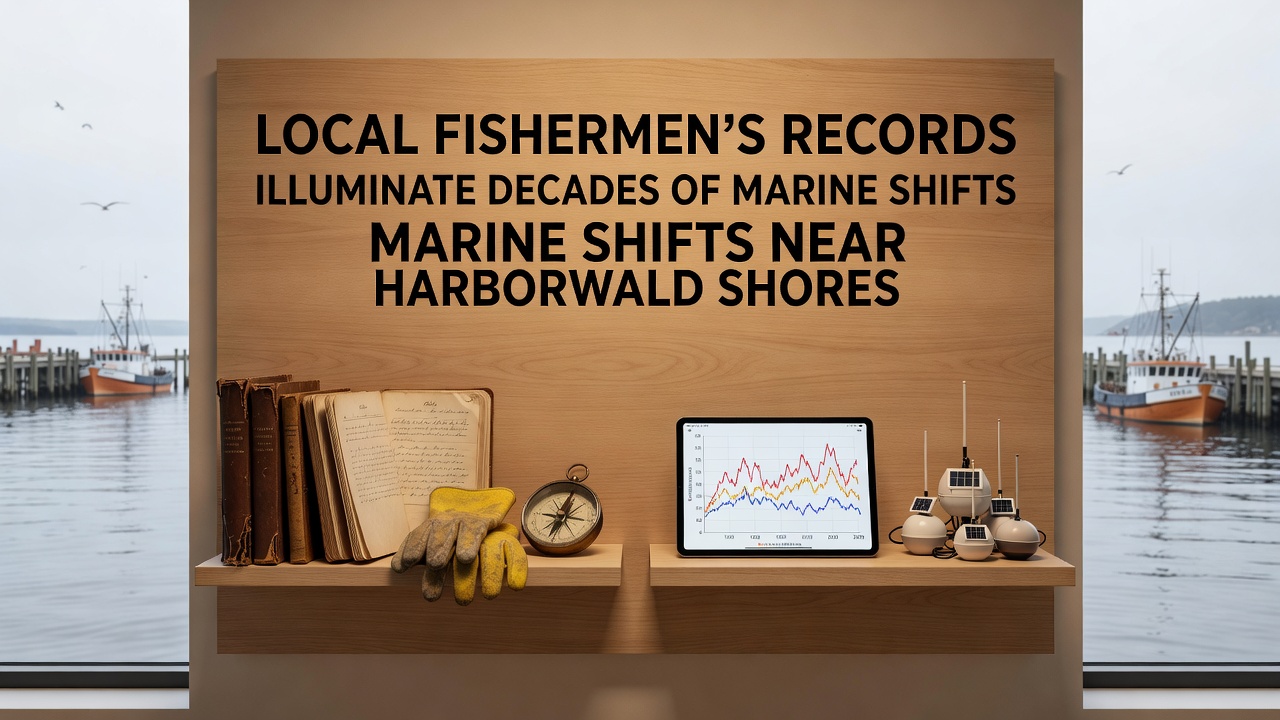
According to records maintained by the National Oceanic and Atmospheric Administration, sea surface temperatures in the region have risen approximately 1.2 degrees Celsius since 1980. Fishermen entries from the same period document parallel changes, including more frequent encounters with species previously associated with waters further south. One study released in early 2026 by a Canadian research institute compared these local logs with satellite data and confirmed the alignment between anecdotal observations and instrument readings.
Integration with Scientific Monitoring
Marine biologists have begun digitizing selected logbooks to create searchable databases that supplement formal surveys conducted every five years. This collaboration allows researchers to fill gaps in years when official vessels could not operate because of weather or funding constraints. The resulting combined dataset shows increased variability in catch composition during El Niño-influenced years, a pattern visible in both professional and amateur records.
Community meetings held in September 2026 highlighted how these long-term observations help forecast stock movements for the coming season. Participants reviewed charts that plotted catch locations against temperature anomalies, demonstrating that fishermen's spatial notes remain valuable for mapping shifting habitats even without advanced equipment.
Conclusion
Fishermen's records continue to serve as an independent source of information on marine conditions near Harborwald Shores. When combined with data from agencies such as the European Environment Agency and the National Oceanic and Atmospheric Administration, they strengthen understanding of gradual ecosystem transformations that unfold over multiple decades. Ongoing digitization efforts ensure these observations remain accessible for future analysis and planning.